
Meta Title: What Is Price Action Trading? Complete 2026 Guide for New & Intermediate Traders
Meta Description: Learn what price action trading is, how to read candlestick patterns and key support/resistance levels, build a rules-based strategy, and develop your skills across any financial market in 2026.
Key Takeaways
Price action trading focuses on raw price movement on charts, often with minimal indicators like a few moving averages, rather than complex indicator stacks.
Price action refers to the patterns formed by highs, lows, candlesticks, and chart patterns around key support and resistance in any financial market.
Price action traders read “the story of buyers vs sellers” to gauge market sentiment and anticipate future price movements.
Price action trading strategies work across assets (stocks, forex, crypto, indices) and timeframes, but they are inherently subjective and require deliberate practice.
No price action strategy guarantees results; it creates a probabilistic edge that must be backed by discipline, risk management, and continuous skill development.
What Is Price Action Trading?
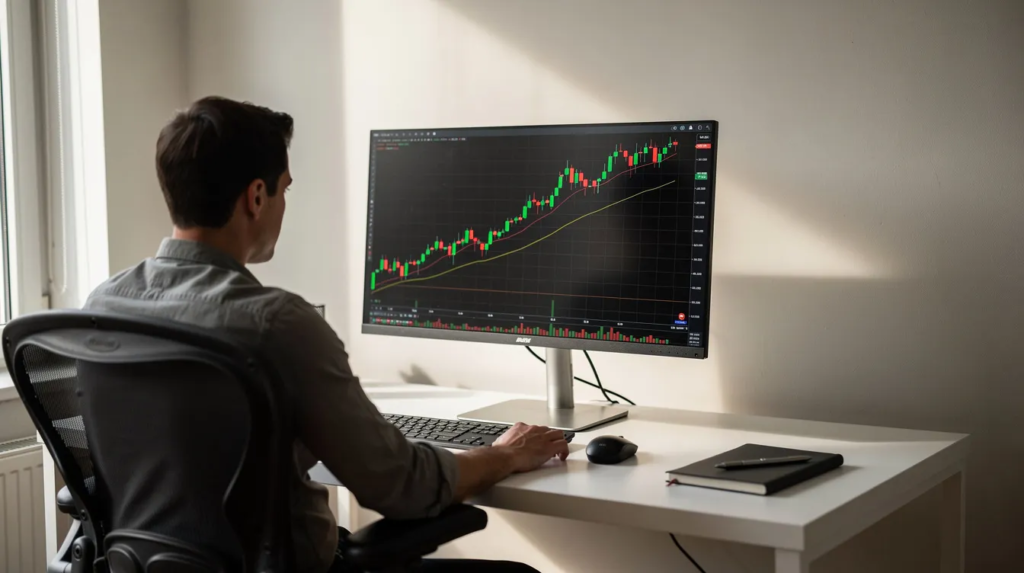
Price action trading is a style of technical analysis where traders base their decisions primarily on how price moves over time on a chart. Instead of stacking lagging indicators or chasing news headlines, price action traders study the raw record of what buyers and sellers are actually doing: swing highs, swing lows, candlestick formations, and how price reacts at important levels. Price action trading relies on historical price movements to read what is happening right now and to anticipate what may happen next.
At its core, price action trading emphasizes understanding market psychology. Every candle on a chart represents a battle between buyers and sellers during a specific period. When you learn to read that battle, you can spot shifts in control, potential reversals, and opportunities to enter or exit trades without waiting for a slow indicator to catch up. Price action can be applied across various financial markets, from EUR/USD on the forex market to Apple stock, gold futures, or Bitcoin.
Here is a concrete example. Imagine a trader watching EUR/USD on the 4-hour chart. After a sustained downtrend, price drops into a historically tested support zone near 1.0700. A bullish pin bar forms, its long lower wick showing clear rejection of lower prices. Without checking RSI or MACD, the trader enters long just above that pin bar’s high, places a stop just below the wick, and targets the next resistance level above. That entire decision was driven by price action analysis: trend context, a key level, and a rejection candle. Many institutional and retail traders in modern financial markets use exactly this kind of approach, either alone or combined with a small set of filters.
Price Action vs Indicator‑Heavy Trading
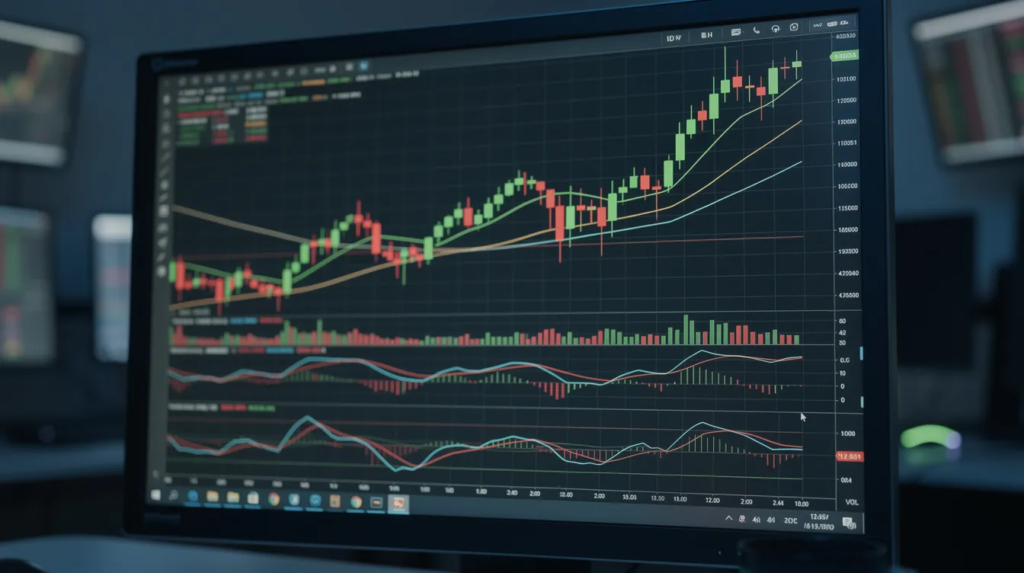
Picture two charts of the same asset. One is a clean candlestick chart with maybe a couple of moving averages and a few horizontal lines marking key levels. The other is buried under RSI, MACD, Bollinger Bands, stochastic oscillators, and three different volume indicators, with price barely visible behind the clutter. Price action traders deliberately choose the first approach.
Most technical indicators are mathematically derived from price. RSI measures relative strength of recent closes. MACD tracks the difference between two moving averages of price. Stochastics compare closing price to a range. None of them can show information that price does not already contain. They are, by definition, lagging indicators, reflecting what has already happened rather than what is about to happen. This creates a real risk of confusing the “map” with the “territory.” When RSI says oversold, MACD shows bearish divergence, and a moving average is still trending down, a trader can freeze in analysis paralysis. Meanwhile, the actual price behavior at a key support level may be telling a much clearer story.
That said, many price action traders do not reject every indicator outright. A common approach is to keep one to three simple moving averages on the chart, such as a 20-period or 50-period EMA, used purely as dynamic support and resistance or as a quick visual filter for trend direction. The key distinction is that these filters support the price action view; they do not replace it. Price action traders often use naked charts without indicators for their core analysis, adding only the minimal tools that help them stay oriented within the trend.
By eliminating or minimizing indicators, traders force themselves to analyze price action itself: trend structure, volatility contraction and expansion, candlestick patterns, and key levels where the market has historically reversed or stalled.
Core Principles Of Price Action Analysis
Before executing any price action strategy, you need to understand the building blocks. Think of these as the grammar of the market’s price chart. Without them, individual candles and patterns are just noise.
Market Structure
Market structure is the sequence of swing highs and swing lows that defines trend direction. A market is in an uptrend if it makes higher highs and higher lows. A market is in a downtrend if it makes lower lows and lower highs. Consolidation occurs when a market lacks a discernible trend, with price oscillating between defined boundaries.
Price action traders identify trends using price dynamics rather than formula-based tools. Trends can be confirmed by observing multiple price swings in the same direction, not just one or two candles. A break in structure, such as a formerly trending market failing to print a new higher high, can signal a shift worth watching.
It also helps to think in terms of broader market phases. Market phases include accumulation, markup, distribution, and markdown. Accumulation is the quiet base-building phase where smart money enters. Markup is the upward trend. Distribution is the topping phase where early buyers exit. Markdown is the decline. Understanding where you sit in this cycle changes how you interpret every candle and pattern.
Support and Resistance
Support and resistance levels indicate where buying or selling pressure is strong enough to reverse or stall price. Support levels indicate where buying demand typically emerges, while resistance levels show where selling supply increases. Traders identify support and resistance by analyzing historical price action, looking for prices that have acted as turning points multiple times.
These levels act as psychological barriers in trading. Prices often reverse or stall at support and resistance levels because market participants cluster their orders there. A resistance level near a round number like EUR/USD 1.1000 or Bitcoin at $100,000 carries extra weight because of the sheer volume of orders placed at round figures.
Rather than drawing exact lines, experienced traders mark zones. Markets rarely reverse at a precise pip. A support or resistance zone of 10–30 pips (in forex) or a few dollars (in stocks) is more realistic and actionable.
Candlestick Patterns
Candlestick charts originated from Japanese rice traders in the 1700s and remain the most popular chart type among price action traders today. Candlestick patterns are used to gauge buying and selling pressure within a specific time period. A long wick to the downside, for instance, shows sellers pushed price lower but buyers overwhelmed them before the close.
Volatility Contraction and Expansion
Markets alternate between periods of tight, narrow-range candles (contraction) and explosive, wide-range candles (expansion). Contraction often precedes expansion. When you see a cluster of small candles forming at a key level, it may signal that a significant move is building. Context matters more than any single candle or pattern on its own: a bullish engulfing candlestick pattern at mid-range is far less meaningful than one forming right at major support in a higher-timeframe uptrend.
For example, in early 2026, S&P 500 futures repeatedly failed at a resistance zone near 5400, making three swing highs at that level before a strong downside move. Traders who recognized that structure, the triple rejection, and the fading momentum candles at resistance had a clear price action signal to act on.
Essential Price Action Tools On The Chart
“Tools” in price action trading are simple visual elements on a price chart, not complex formulas or proprietary indicators. Setting up a basic chart takes just a few steps, and getting this right gives you a cleaner view of the market’s price movement.
Chart Setup
Start by choosing a candlestick chart type. Each candlestick shows the open, close, high, and low prices for a given period, giving you more information than a line chart at a glance. The opening price and closing price positions tell you who won the period (buyers or sellers), while the wicks reveal the extremes.
Select a timeframe that matches your specific trading style. Swing traders typically use daily and 4-hour charts. Day traders may prefer 1-hour or 15-minute charts. Remove all indicators except perhaps two moving averages, such as a 20-period EMA and a 50-period EMA. These serve as dynamic support and resistance and quickly show you whether price is in an upward trend or downtrend.
Horizontal Support and Resistance Levels
Mark prices where the market has reversed or consolidated multiple times in the past. These are your key support and resistance levels. Draw them as zones rather than single lines, giving price room to breathe. Prior day, week, and month highs and lows are also important structural markers that many traders and institutions watch.
Psychological Levels
Round numbers carry extra significance. EUR/USD at 1.1000, GBP/USD at 1.3000, and Bitcoin at $100,000 are all examples where market participants tend to cluster orders, creating natural support or resistance.
Trendlines
Trend lines connect sequential swing lows in an uptrend or swing highs in a downtrend, showing the slope and character of the move. A break of a well-established trendline can signal a potential shift in market direction.
How To Analyze Price Action Step‑By‑Step
This section gives you a practical, repeatable checklist you can use every time you open a chart. Consistency in process reduces subjectivity and helps you track your trading results over time.
Step 1: Top-Down Analysis
Begin on a higher timeframe (weekly or daily) to identify overall market direction. Is the market trending or consolidating? Mark major support and resistance zones. Then drop to a lower timeframe (4-hour or 1-hour) to refine potential entry points.
Step 2: Read the Sequence of Highs and Lows
Traders identify trends by observing sequences of highs and lows. On your lower timeframe, classify the market:
Structure | What You See | Market Bias |
|---|---|---|
Higher highs + higher lows | Uptrend | Bullish |
Lower highs + lower lows | Downtrend | Bearish |
Overlapping highs and lows | Range/Consolidation | Neutral |
Look for breaks in structure. If an uptrend stops making higher highs, it signals potential exhaustion. If a downtrend fails to print a new lower low, buyers may be stepping in.
Step 3: Watch Price Behavior at Key Levels
As price approaches key support or a resistance level, observe how price behaves. Strong momentum candles pushing through a level suggest a breakout. Slowing candle ranges, overlapping bars, and long rejection wicks suggest the level is holding. This is where price action reflects the real-time struggle between supply and demand.
Step 4: Identify Your Entry Trigger
Look for a specific candlestick confirmation: a pin bar rejecting a level, a bullish engulfing candlestick pattern at support, or an inside bar breakout in the direction of the prevailing trend. The trigger should align with your trend context and the key level.
Step 5: Define Stop Loss and Target
Place your stop just beyond the recent swing high or low, or outside the rejection wick. Set your target at the next visible support or resistance level. Aim for a risk-to-reward ratio of at least 1:2, ideally 1:3.
Step 6: Size Your Position
Risk a small, fixed percentage of your account per trade, typically 1–2%. Use the distance between entry and stop to calculate position size. Avoid overleveraging.
Walkthrough Example
Suppose in mid-2025, Apple stock is in a weekly downtrend with lower highs and lower lows. On the daily chart, price rallies into a resistance zone, a cluster of prior swing highs from mid-2024. A bearish engulfing candle forms at that zone. You drop to the 4-hour chart and see an inside bar forming after the engulfing candle, indicating consolidation and a potential breakout in the direction of the larger downtrend. When price breaks below the inside bar’s low, you enter short with a stop just above the engulfing candle’s high. Your target is the next swing low on the daily chart. Risk is set to 1.5% of your account. You document the trade in your journal: entry reason, level, structure, wicks, timeframe context. After the trade closes, you review the outcome.

Key Price Action Patterns And Signals
Price action patterns are the vocabulary of price charts. They help you identify patterns in market behavior and spot potential entry points. However, patterns only matter when they appear at meaningful locations on the chart, not in random areas.
Reversal Candlestick Patterns
Pin bar (hammer and shooting star): A pin bar has a long wick and a small body, showing strong rejection at a level. A hammer pattern indicates potential bullish reversals after a downtrend, with the long wick pointing down as sellers are overwhelmed. A shooting star pattern suggests potential bearish reversals after an uptrend, with the long wick pointing up as buyers lose control. Pin bars are among the most popular price action signals because they visually capture selling pressure or buying pressure at a specific level.
Engulfing patterns: A bullish engulfing candle completely covers the prior candle’s body, signaling a shift from sellers to buyers. A bearish engulfing does the opposite. These are most powerful when they form at major support and resistance levels.
Outside bars: An outside bar completely overlaps the previous bar, indicating strong market movement and often a decisive shift in control.
Continuation Signals
Inside bar: An inside bar is smaller than the previous bar and indicates consolidation. It often forms mid-trend as the market pauses before the trend resumes. A breakout above or below the mother bar gives a directional signal. In trending markets, inside bar breakouts in the trend direction can offer clean continuation entries.
Small consolidations: Flags, pennants, and tight rectangles within a trending move are price action continuation patterns. Price contracts, volatility drops, and then the market pulls energy from the consolidation to launch the next leg.
Classic Chart Patterns
Price action traders also watch for larger chart pattern formations:
Double tops and bottoms: Reversal formations where price hit resistance or support twice and failed to break through.
Head and shoulders (and inverse): Indicating trend reversal when the structure is clean with a clear neckline.
Wedges and triangles: Rising or falling wedges often signal weakening price trends. Symmetrical triangles tend to break in the direction of the prevailing trend.
Flags and pennants: Continuation patterns forming after an impulsive move.
Trade patterns mainly when they appear at meaningful locations. A pin bar at key support in a higher-timeframe uptrend is a signal. A pin bar in the middle of a choppy range with no context is just noise.
The breakout and retest strategy involves confirming a price move after a level break. When price breaks through support or resistance and then retests that broken level from the other side, it offers a higher-probability entry because the old resistance level becomes a new support level (or vice versa).
Building A Basic Price Action Strategy
Now it is time to combine the earlier concepts into a simple, rules-based price action strategy. A strategy without clear rules is just guessing with extra steps.
Trend-Following Strategy Example
Trade only in the direction of the higher-timeframe trend. On the daily chart, confirm that market structure shows higher highs and higher lows (for longs). Then drop to the 4-hour chart and wait for a pullback to a moving average (like the 50 EMA) or to a previous support zone that was once resistance. When a bullish candlestick confirmation forms at that level, such as a pin bar or engulfing candle, enter long. Place your stop below the recent swing low. Target the next resistance level, aiming for at least a 1:2 risk-to-reward ratio. If the pullback retraces more than 50–60% of the prior move, skip the trade.
Range-Trading Strategy Example
When the market is consolidating within a clear range, identify the boundaries. At the support level, look for rejection candles (long wicks, pin bars, or fake breakouts below support that quickly reverse). Enter long with a stop just outside the zone and target the opposite boundary. At resistance, look for the same rejection signals in reverse. Avoid trading in the middle of the range where the market lacks directional bias.
Risk Management Rules
No price action methodology works without disciplined risk management.
Traders should set protective stop-loss orders on every trade, placed beyond recent structure or wicks.
Risk a fixed 1–2% of account equity per trade.
Traders often use support and resistance levels for trade management, trailing stops to lock in profit as price moves favorably.
Exiting trades using wicks can indicate trend weakening; if wicks start appearing against your position at key levels, consider tightening your stop.
Managing trades requires adjusting risk appetite based on market behavior. If volatility spikes, you may need to widen stops and reduce position size.
Traders should monitor their trades closely near key levels, where price is most likely to reverse or accelerate.
No price action strategy predicts the future with certainty. It only creates a probabilistic edge that must be backed by strict discipline and consistent position sizing. Even strategies with a claimed 60–75% success rate depend heavily on trader skill, market conditions, and emotional control.
Pros And Cons Of Price Action Trading
Price action is powerful but not perfect. Understanding both sides helps you set realistic expectations and avoid common traps.
Advantages
Simplicity: Clean charts force you to focus on what matters: the asset’s price and how it moves at key levels.
Flexibility: Price action trading strategies work across stocks, forex, crypto, commodities, and indices. You can trade price action on any timeframe.
Speed: Signals appear directly on price charts bar by bar, with no lag from indicator calculations. Reading price charts bar by bar gives you real-time information.
Adaptability: Because you are reading market behavior directly, you can adjust to changing conditions faster than indicator-dependent systems.
Limitations
Subjectivity: Two traders looking at the same chart may see different patterns. Price action trading can reveal conflicting signals due to its subjectivity. What looks like a pin bar to one trader may be noise to another.
Learning curve: It takes months of practice to consistently read market structure, candlestick patterns, and key levels in real time.
Pattern blindness: Once you learn price action patterns, you may start to “see” them everywhere, including in random noise. This is why context and selectivity are critical.
Emotional difficulty: Losing streaks are inevitable. Without confidence in your process, it is easy to abandon a sound price action technique after a few losses.
Combining price action with one or two additional tools, such as volume confirmation or a trend filter like a moving average, can reduce subjectivity without overcomplicating the chart. According to Tradewink research from 2026, alignment of higher timeframe trend and volume confirmation significantly improves success probability of setups like pin bars and inside bars.
Test any price action approach on historical data and in demo accounts before risking real capital in live financial markets.
Price Action In Modern Financial Markets (2020–2026)
Since 2020, financial markets have changed substantially. Algorithmic trading volumes have surged. Crypto markets trade 24/7. Data moves faster. The pandemic-era market swings of 2020–2022 and the AI-fueled stock rallies of 2024–2025 tested every trading approach.
Despite high-frequency trading and automation, human behavior still drives many of the price action features traders rely on. Fake breakouts happen because other traders panic and chase. Euphoric rallies form because market participants pile in with fear of missing out. Panic selling pressure creates capitulation wicks. These behavioral patterns are as old as markets themselves, and they continue to show up on price charts regardless of how many algorithms are running.
Price action techniques apply to stocks, forex, commodities, indices, and cryptocurrencies, but volatility profiles and session hours differ between markets. Crypto, for instance, trades around the clock and tends to exhibit larger wicks and faster moves, meaning price action patterns may form and complete faster. During the 2024–2025 AI stock rallies, Nasdaq 100 chart patterns formed on compressed timeframes, requiring quicker decision-making and tighter stops. Most retail traders who stuck with higher timeframes navigated these moves more effectively than those over-trading on 5-minute charts.
Some traders now use algorithmic scanners to find price action setups, flagging pin bars at key support, inside bars at structure, or breakouts from consolidation automatically. The final decision, however, typically remains manual. Scanners handle the filtering; the human handles context, selectivity, and execution. This semi-automated workflow is increasingly common among both retail traders and small proprietary trading firms.
In fast-moving or news-driven markets, fundamental analysis still matters as a backdrop. Knowing that a central bank decision is imminent or that an earnings report is due can help you understand why price behaves the way it does at a given level. Price action does not exist in a vacuum; it benefits from awareness of the broader environment.
Developing Your Price Action Skills Over Time
Price action trading skill is built through deliberate practice, not by memorizing dozens of patterns overnight. Most traders who attempt to learn everything at once end up confused and inconsistent. Depth beats breadth, especially in the first year.
Practical Exercises
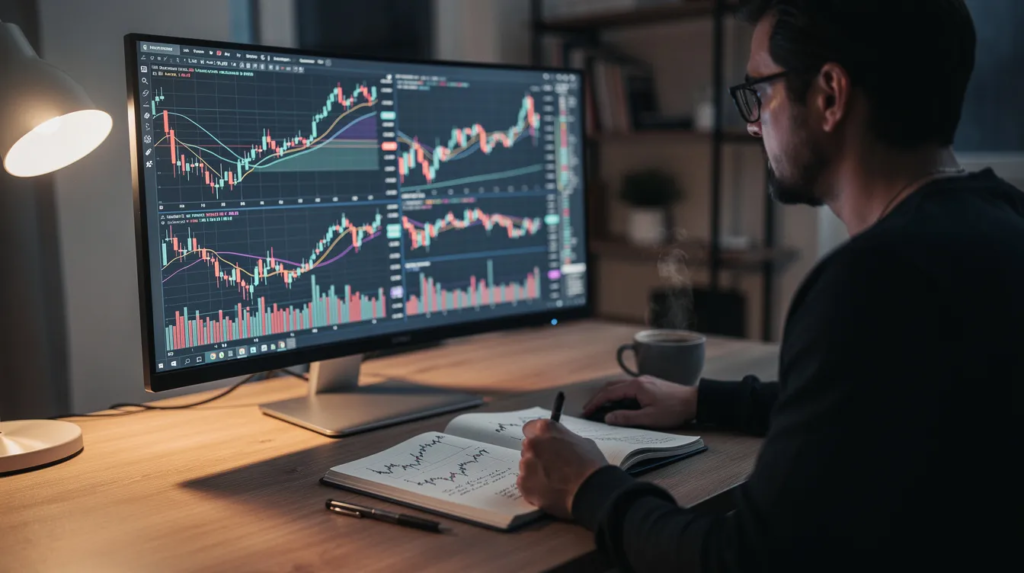
Screenshot and mark up charts. After each session, save charts with setups you noticed, both trades you took and ones you skipped. Annotate them: what was the trend? Where was the key level? What was the candlestick signal?
Journal every trade. Record your entry reason, the level, the market structure context, the candle that triggered your entry, your stop, your target, and the outcome. Over time, this data reveals which setups truly deliver profitable trading results for you and which only look good in hindsight.
Review historical data. Scroll through past charts bar by bar, simulating real-time reading. This builds pattern recognition without risking capital.
Focus On A Limited Set of Setups
Instead of chasing every pattern, pick two or three. Pin bars at key support in trending markets. Inside bar breakouts in the direction of the prevailing trend. Engulfing candles at structure after an extended move. Master these first. Add complexity only after you have solid statistics and confidence.
Track Your Statistics
For each setup, track your win rate, average reward-to-risk ratio, and expectancy. If a setup works in theory but not in your execution, the data will show it. This separates what genuinely works from what only appears to work on social media screenshots.
Mindset and Consistency
Patience, emotional control, and consistency are as central to successful price action trading as technical knowledge. Many traders fail not because their strategy is bad but because they abandon it during inevitable drawdowns. Accept that losses are a cost of doing business. The goal is not to win every trade but to have an edge over a series of trades.
Markets change over time. What worked during the bull market of 2021 may underperform in the choppy, range-bound conditions of mid-2026. Continuously assess which markets, timeframes, and patterns have better performance, and adapt.
Summary: Where Price Action Trading Fits In Your Toolkit
Price action trading is a foundational approach to reading financial markets. It treats price itself as the primary indicator and uses tools like candlestick patterns, chart patterns, and key support and resistance for informed trading decisions. Price movements reflect the psychology of market participants, and learning to read those movements gives you an edge in timing, risk management, and overall market understanding.
You do not have to choose between price action and all other methods. Many successful traders combine price action with fundamental analysis or a small set of technical indicators. The price action methodology serves as the core framework; other tools serve as filters and context providers.
Start small. Practice on a demo account or with minimal position sizes. Write down a clear price action strategy with specific rules for entries, exits, and risk. Refine it based on real data and journaling. Scale up only when you have confidence backed by tracked results.
No approach removes risk from trading financial markets. Market moves will sometimes go against you regardless of how clean the setup looks. But understanding how to trade price action, how to analyze price action at key levels, and how to find your optimal entry point based on market structure can significantly improve your trading decisions and long-term performance. Price action will not make you a fortune overnight, but it gives you a framework for reading the market that most retail traders never develop.
FAQ
Is price action trading suitable for complete beginners?
Beginners can absolutely start with price action, but they should first learn the basics: how to read candlestick charts, how timeframes work, and how to identify support and resistance. Without this foundation, patterns will look like random shapes.
New traders should focus on one or two simple setups on a higher timeframe, like daily charts, where price action patterns are cleaner and less affected by random noise. This prevents overtrading and information overload. Begin with a demo account or very small position sizes while you learn to analyze price action and build confidence. There is no shortcut here; screen time and journaling are the fastest teachers.
Which timeframes work best for price action traders?
There is no single “best” timeframe. Swing traders often use daily and 4-hour charts. Day traders work on 1-hour, 15-minute, or 5-minute charts. Instruments favored by price action traders, such as EUR/USD, GBP/USD, gold (XAU/USD), and Nasdaq 100, tend to produce cleaner setups on H1, H4, and daily timeframes.
Start on higher timeframes (4-hour and daily) where patterns are more defined and less distorted by market noise. As you gain experience, multi-timeframe analysis becomes valuable: use the weekly chart for overall trend, daily for key levels, and 4-hour or 1-hour for entry timing. This layered approach is common among experienced price action traders.
Can price action trading be fully automated?
Parts of price action can be coded into rules and scanners. Identifying inside bars, pin bars at predefined levels, or breakout candles is relatively straightforward to automate. However, full automation is challenging because so much of interpreting price action depends on context: trend quality, proximity to key levels, wick characteristics, and how the market behaves leading into a setup.
Many traders use semi-automated workflows where algorithms scan for specific patterns and flag them, while the human decides which setups to trade based on contextual judgment. Even with automation, risk controls and human oversight are essential, especially in highly volatile or news-driven markets where future price movements can deviate sharply from historical norms.
Do price action traders ever use indicators like RSI or MACD?
“Pure” price action traders often avoid most indicators, preferring to let price speak for itself. But in practice, many traders use a few simple tools as confirmation or filters. A moving average can define trend direction. RSI can flag potentially overextended price swings, helping you avoid entering at the tail end of a move.
The critical rule is that indicators, if used, should support the core price action view rather than replace it or clutter the chart. If you need four indicators to confirm a trade and they are all giving conflicting signals, you have moved away from price action and back into indicator-heavy territory. Keep it simple. One or two filters are enough.
How long does it take to become consistently profitable with price action?
Timelines vary widely. Many traders need at least 6–24 months of focused practice and review before they see consistent trading results. Some take longer, depending on how much time they can dedicate and how disciplined their practice is.
Factors that speed up learning include keeping a detailed trading journal, specializing in a small set of markets and setups, and reviewing both winning and losing trades honestly. Traders who skip journaling and jump from pattern to pattern tend to stay stuck longest.
Markets also change over time. Even experienced price action traders continuously adapt and refine their strategies. The market conditions of 2024 are not the market conditions of 2026. Consistent profitability is not a destination; it is an ongoing process of observation, adaptation, and disciplined execution. Potentially profit comes from the compound effect of small edges repeated over hundreds of trades, not from any single magical setup.